Last updated: April 10, 2025
Article
Response of the Forest to Reduced Impacts of White-tailed Deer

Photo: NPS / Doug Marcum
Cuyahoga Valley National Park (NP) is 33,000 acres in size and contains some of the largest remaining tracts of forest in northeast Ohio. The park’s forests are primarily deciduous, with oak/hickory (Quercus/Carya) communities being the most widespread. Other forest communities include beech/maple (Fagus/Acer), maple/sycamore (Acer/Platanus), and hemlock/beech (Tsuga/Fagus). Fields, wet meadows, and other types of wetlands, as well as the Cuyahoga River, also occur in the park. Cuyahoga Valley NP is known to have more than 1,100 species of plants (NPSpecies), some of which are favored by white-tailed deer (Odocoileus virginianus), one of the park’s many mammal species.
Overabundant Deer in the Cuyahoga Valley
The white-tailed deer is native to Ohio and part of the natural ecosystems in the park and surrounding area. However, a mix of factors—such as changes in land use and a lack of predators—have led to deer populations reaching high numbers. Overabundant deer populations can have adverse effects on an area’s vegetation. For example, a study of forests in 39 national parks in the eastern United States, from Maine to Virginia, found that overbrowsing by deer was a main reason for the absence or low density of canopy species in the understory of most of the parks (Miller et al. 2023). An absence of or too few seedlings and saplings means that the forests are not regenerating.
Long-term ecological monitoring and other studies at Cuyahoga Valley NP have found that overbrowsing by deer is interfering with the growth of seedlings, limiting their height, and reducing the growth of native groundcover plants. Park biologists also found a relationship between deer browsing and decreased numbers of forest songbirds (NPS 2014).
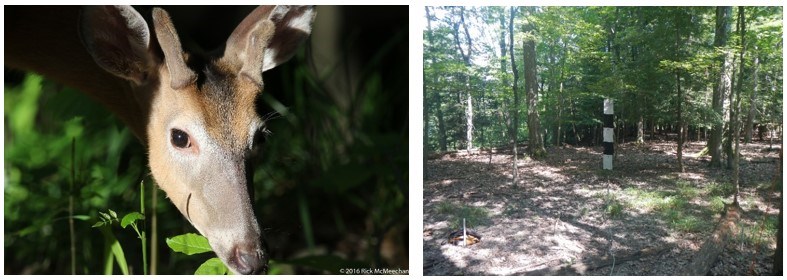
Photos: © Rick McMeechan (left) and NPS (right)
Park biologists at Cuyahoga Valley NP have been monitoring the park’s deer population and effects on park vegetation since the late 1990s. Long-term monitoring programs continue today and include deer population density and forest plant community monitoring. In 2016 the park began implementing a white-tailed deer management program, as outlined in the White-tailed Deer Management Plan, with the goal of supporting long-term protection, preservation, and restoration of native vegetation and other natural and cultural resources in Cuyahoga Valley NP (NPS 2014). This includes management to ensure that deer do not become the dominant (and unnatural) force in the ecosystem, adversely impacting forest regeneration, sensitive vegetation, and other wildlife. The management plan allows for the removal of deer on an annual basis, if needed, to achieve and maintain plan goals. The park partners with the U.S. Department of Agriculture to remove deer, with deer meat donated to local food banks.
25 Years of Data Collection on Plants and Deer
To determine how park vegetation is responding to deer management, researchers at Southern Illinois University analyzed data collected by park biologists and volunteers over a 25-year time period (1998–2023). These data are from three separate park monitoring efforts to quantify impacts of deer on forest plant communities. The efforts include: 1) the use of long-term ecological monitoring (LTEM) plots, 2) deer exclosures (which keep deer out) and associated unfenced control plots, and 3) trillium monitoring in fenced exclosures and unfenced controls, as well as deer population monitoring using a scientifically rigorous method called distance sampling. Below are some key features of these efforts:
-
In LTEM plots and deer exclosures (and associated unfenced control plots), biologists measure seedlings, shrubs, saplings, and mature trees. By measuring the height of the tallest seedling for each species in 1-meter-radius (3.3-foot-radius) plots, biologists can track regeneration over time. Within the shrub layer (less than 1.5 meters [4.9 feet] in height), the number of stems of each species are counted to determine the diversity and abundance of native plants in this layer of the forest that is most directly impacted by deer.
-
Biologists conduct woody browse surveys at deer exclosures (25 sites) and 49 LTEM plots. The purpose of the browse surveys is to estimate the percentage of buds that are browsed by deer during the winter months. Buds are where new plant growth takes place—at the end of a stem or at other locations on the stem. Deer browse on woody buds causes the plants to die back; when browsed heavily in a single year or moderately over multiple years, the entire plant may die.
-
Trillium monitoring is conducted in fenced exclosures (1 meter by 1 meter [3.3 feet by 3.3 feet]) and unfenced controls. Volunteers work with park biologists on the monitoring, which is one of the park’s longest running programs. Trillium (Trillium grandiflorum) is an understory plant that is often used as an indicator of deer impacts for the spring ephemeral community (those plants with a short period of growth in the spring) and forest decline (Knight et al. 2009). You might also know trillium as Ohio’s state wildflower. When trillium are browsed at a high rate (>15%), the population can decline or be lost.
-
Plant monitoring is conducted on different schedules. For instance, trillium is monitored every year. The LTEM plots and deer exclosure plots are monitored every 3 to 4 years; however, seedling plots at exclosures were monitored every year from 2016 to 2023.
-
Park biologists have been monitoring the white-tailed deer population at Cuyahoga Valley NP using spotlight surveys since 1990. In 1998, they modified the methods to use distance sampling along with spotlight surveys for annual monitoring.
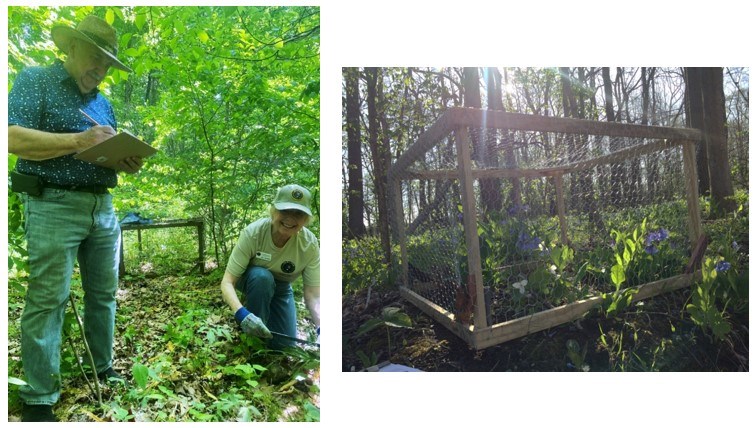
Both photos: NPS / Ryan Trimbath
A Summary of the Study Findings
Through the deer management program, Cuyahoga Valley NP managers and partners (U.S. Department of Agriculture, Cleveland Metroparks, Summit Metro Parks, and Ohio Division of Wildlife) have significantly reduced the density of deer (the number of animals per area of park land) within the park to effectively reduce damage on forest plant communities. If you take a walk in the woods today, you can see that the forest vegetation has responded positively. All of the long-term monitoring efforts have helped biologists understand and quantify the changes that have occurred. Here’s what they’ve seen:
-
Reduced deer densities, closer to the estimated historic (pre-European settlement) density of 23 deer per square mile, as a result of deer removal efforts by park partners (started in 1998) and Cuyahoga Valley NP managers (since 2016).
-
A reduction of direct impacts of deer on woody plants (that is, a reduction of woody browse).
-
Forest regeneration, as evidenced by an increase in seedling heights, and increases in native species diversity (a measure of the number of species and abundance) and richness (the number of species).
-
Reduced browse levels on trillium and other spring ephemeral plants (those with a short period of growth in the spring) at lower deer densities; however, large, flowering trillium seem to be browsed at higher rates than non-flowering trillium.
-
A healthier deer population at lower deer densities. At lower densities, deer body weight, an indicator of health (such as, Putman et al. 2019), is higher in the park.
A Closer Look at Our Study Findings
Deer Density
Park biologists estimate deer population density every year in the fall (1998–present) using parkwide spotlight surveys and following a distance sampling protocol. From 1998 to 2023, deer densities were at a high point in 1999, when they were estimated to be over 78 deer/mi2 (Figure 1). Cleveland Metroparks and Summit Metro Parks began efforts to control the deer population on their properties within the Cuyahoga Valley in 1998 and 2001, respectively. These efforts broadly impacted the deer population, and declines in density within the park were observed from 2000 to 2015. However, the population remained at a level that was causing adverse ecological impacts on federal lands within the Cuyahoga Valley. The NPS deer management program began in the winter of 2016 and has continued every year since, further reducing deer densities to the estimated historic (pre-European) density of 23 deer/mi2 (NPS 2014). Prior to the 2024 management season (that is, in Fall 2023), park-wide estimates were the lowest recorded to date, at 18 deer/mi2.
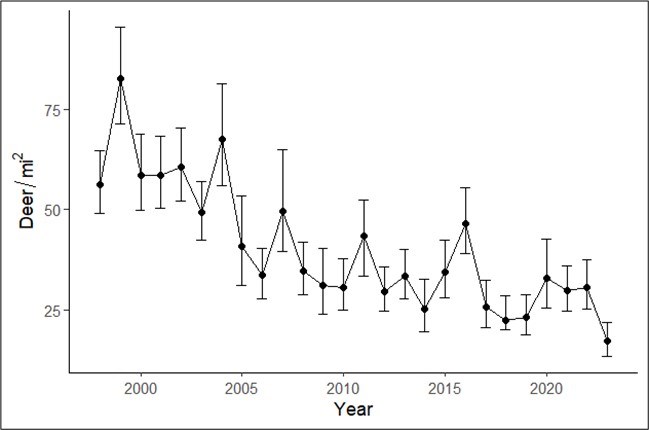
Figure source: Trowbridge (2023).
Reduction of Direct Impacts on Woody Plants
Since 2017, park biologists have been monitoring deer browse every other year to quantify the damage deer have caused to native woody plants in the forest understory. Starting in late February and March, plots are visited and the number of browsed vs. unbrowsed buds are counted within 5-meter-radius (16-foot-radius) plots. Buds, where new plant growth takes place, are located at the end of a stem or at other locations on the stem. Woody plants form buds and drop their leaves in late summer and early fall. Deer browse the buds through the fall and winter. By conducting the monitoring just before the end of winter—prior to buds opening—biologist can quantify total browse over the fall and winter.
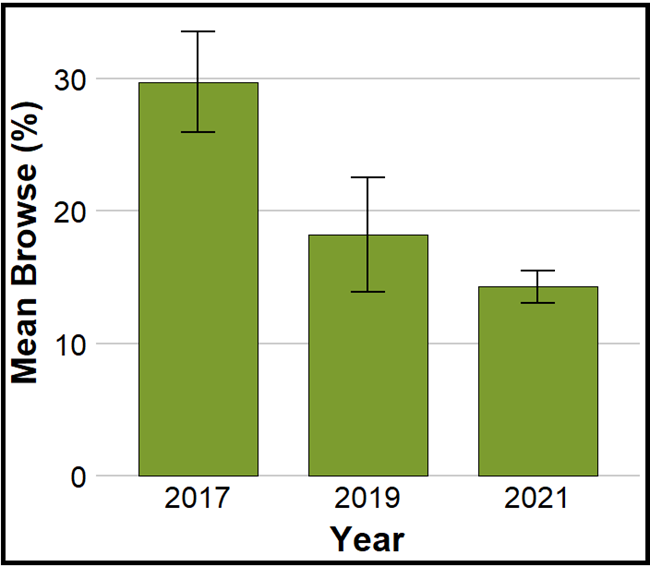
Data source: NPS; figure modified from Trowbridge (2023).
Southern Illinois University analysis of park monitoring data indicated that there has been a significant reduction of deer browse on native woody plants, as measured by the proportion of woody buds browsed over time (Figure 2). Monitoring results show a significant reduction in the proportion of woody buds browsed in 2019 and 2021 from 2017 levels.
White-tailed deer, like most herbivores, browse selectively. Some plant species have evolved physical or chemical defenses that make them less tasty. As a result, deer browse on some plant species more frequently than on others. Deer preference for plants has been well studied, and the results provide general information on what deer prefer. However, research has also shown deer plant preference to vary regionally and even by individual animal, so it is important to understand what the deer herd at Cuyahoga Valley likes. In order to figure this out, Southern Illinois researchers looked at woody browse levels in particular tree and shrub species (Table 1) based on their availability.
All of the species in Table 1 have experienced reduced browse impacts with deer management, but to differing degrees. Even though browse impacts have declined overall, browse on some of the preferred species remained relatively high in 2021. Examples of such plants are brambles, greenbrier, elm, and blueberry. Reducing deer browse on these more preferred species is important for conserving biodiversity in the forest. Highly preferred species can be suppressed and lost, leading to reduced overall diversity in the forest understory.
| Preference/no preference for plant | Tree/Shrub | Percentage (%) of woody buds browsed | |||
| Common Name | Genus |
|
|
|
|
| avoided | Buckeye | Aesculus |
|
|
|
| Beech | Fagus |
|
|
|
|
| Spice Bush | Lindera |
|
|
|
|
| neither avoided nor preferred | Maple | Acer |
|
|
|
| Hickory | Carya |
|
|
|
|
| Witch Hazel | Hamamelis |
|
|
|
|
| Oak | Quercus |
|
|
|
|
| preferred | Dogwood | Cornus |
|
|
|
| Hawthorn | Craetagus |
|
|
|
|
| Cherry | Prunus |
|
|
|
|
| Brambles | Rubus |
|
|
|
|
| Sassafras | Sassafras |
|
|
|
|
| Greenbrier | Smilax |
|
|
|
|
| Elm | Ulmus |
|
|
|
|
| Blueberry | Vaccinium |
|
|
|
|
| Viburnum | Viburnum |
|
|
|
|
How can a reduction in browse help wildlife?
A healthy forest understory, with a diverse and abundant native plant community, is important for providing habitat for wildlife species. An example of how decreasing deer damage to vegetation can benefit other wildlife in the forest can be found with some of the plants listed in Table 1—viburnum, brambles, and greenbrier. These are some favorite deer foods, but they are also important to other species, such as hooded warblers (Setophaga citrina) (see below). These and other understory shrub species are used by hooded warblers for nesting and foraging; the plants provide a safe place for the birds to secretively go about their business and avoid predators. Reducing browse impacts on these plants makes nesting habitat more available for hooded warblers, and with more places to hide and forage the nests are more likely to be successful.
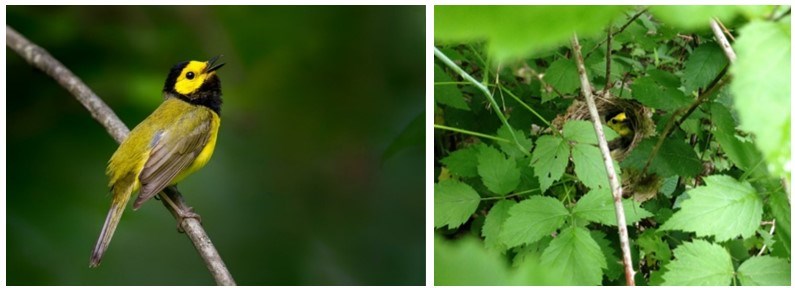
Photos: © Jim Roetzel (left) and NPS / Ryan Trimbath (right)
Evidence of Increased Forest Regeneration
From the monitoring results, researchers found evidence that the forest is responding in various ways to the reduced deer population. The regeneration of tree seedlings has shown a positive trend; the evidence for this is an observed increase in the height of tree seedlings within monitoring plots (Figure 3). Seedling height was measured every year from 2016 to 2021 in the (unfenced) forest (that is, control plots), as well as in 10 x 10-meter (33 x 33-foot) fenced areas that exclude deer and protect plants from browse. Seedlings in both control plots and deer exclosures increased in height over time, but seedling heights in exclosures were greater. Increases in tree seedling height indicates survival and growth of young plants. If a seedling reaches 1.5 meters (4.9 feet) in height, it has largely escaped the shrub layer, where deer browse heavily, and would be considered a sapling. Saplings have a chance to become the next generation of canopy trees.

Figure source: Trowbridge (2023).
Additional evidence of forest regeneration was observed after four years of deer removal; researchers found that richness (that is, the number of species) and diversity (a measure of the number of species and of abundance) increased in the long-term ecological monitoring plots. This is important because a more diverse forest is more resilient to changes in the forest.
A Connection Between Trillium Browse and Deer Density
At greater deer densities, trillium plants are browsed by deer at higher rates. Reducing deer density through removal has been effective in reducing damage to trillium and other native plants. Trillium monitoring showed that when the deer population was below 23 deer/mi2, browse on trillium plants (overall) fell below, or near, 15%. However, flowering trillium plants were still browsed at rates above 15%; in 2021 and 2022, browse rates on flowering plants were above 40%. Fifteen percent is a threshold; at browse rates above this threshold, a population can decline or be lost. Reducing browse on flowering trillium is vital because flowering trillium produce the seeds required for the population to recover/persist.
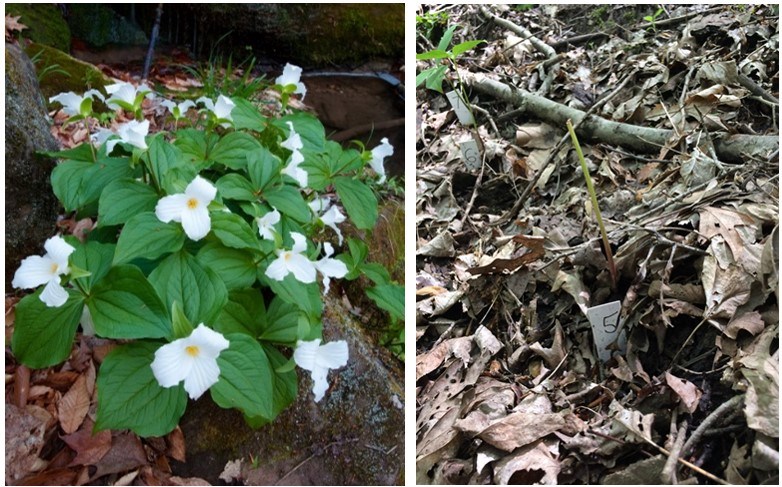
Photos: © Brian Hunsaker (left) and NPS / Ryan Trimbath (right)
Importance of the Study Findings
The Southern Illinois University analysis of the vegetation and deer monitoring data suggested some changes and refinements to the park monitoring program. For example, for the trillium monitoring, biologist found that the trillium measure they had been using—stem height—was less useful than desired. Instead, monitoring browse rates is a more direct measure of impact, which should be maintained below 15% to support a healthy spring ephemeral plant community.
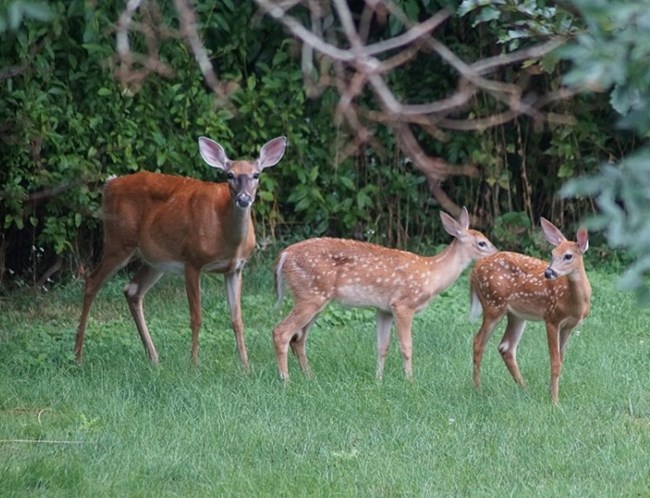
Photo: © Sue Simenc
Continued monitoring of vegetation and the deer population helps set annual goals for Cuyahoga Valley NP’s deer management program. These data are critical to ensuring reduced impacts on park vegetation and, therefore, a healthier forest. The health and diversity of the forest is vital for all forest inhabitants, and a healthier forest is more resilient to disturbances. Also, as observed from the Southern Illinois University analysis, lower deer densities led to higher deer weights (an indicator of deer health). Maintaining the health of the forest and its inhabitants is also essential to the NPS mission to preserve and protect Cuyahoga Valley NP lands and resources for this and future generations.
For More Information on Eastern Forests and White-tailed Deer
- See this NPS series of articles entitled Managing Resilient Forests Initiative for Eastern National Parks.
- Read this article on Managing Deer Impacts, which is part of the above series.
- Explore this StoryMap on several eastern U.S. parks: Case Studies in Deer Management.
References
Knight, T. M., H. Caswell, and S. Kalisz. 2009. Population growth rate of a common understory herb decreases non-linearly across a gradient of deer herbivory. Forest Ecology and Management 257:1095–1103.
Miller, K. M., S. J. Perles, J. P. Schmit, E. R. Mathews, A. S. Weed, J. A. Comiskey, M. R. Marshall, P. Nelson, and N. A. Fisichelli. 2023. Overabundant deer and invasive plants drive widespread regeneration debt in eastern United States national parks. Ecological Applications 33. DOI: 10.1002/eap.2837. Available at: https://esajournals.onlinelibrary.wiley.com/doi/full/10.1002/eap.2837.
National Park Service. 2014. Cuyahoga Valley National Park final white-tailed deer management plan / environmental impact statement. Available at: Search Results - eTIC Pubs.
Putman, R., L. Nelli, and J. Matthiopoulos. 2019. Changes in bodyweight and productivity in resource-restricted populations of red deer (Cervus elaphus) in response to deliberate reductions in density. European Journal of Wildlife Research 65:1–13.
The monitoring results presented in this article are based on the following report, funded by the NPS Natural Resource Condition Assessment Program: Trowbridge, J. 2023. Effects of White-tailed Deer Density on Physical Condition and Forest Vegetation in Cuyahoga Valley National Park. Master’s Thesis, School of Forestry and Horticulture, Southern Illinois University.
