Last updated: April 1, 2025
Article
Vegetation Monitoring at San Antonio Missions National Historical Park: Results for 2023
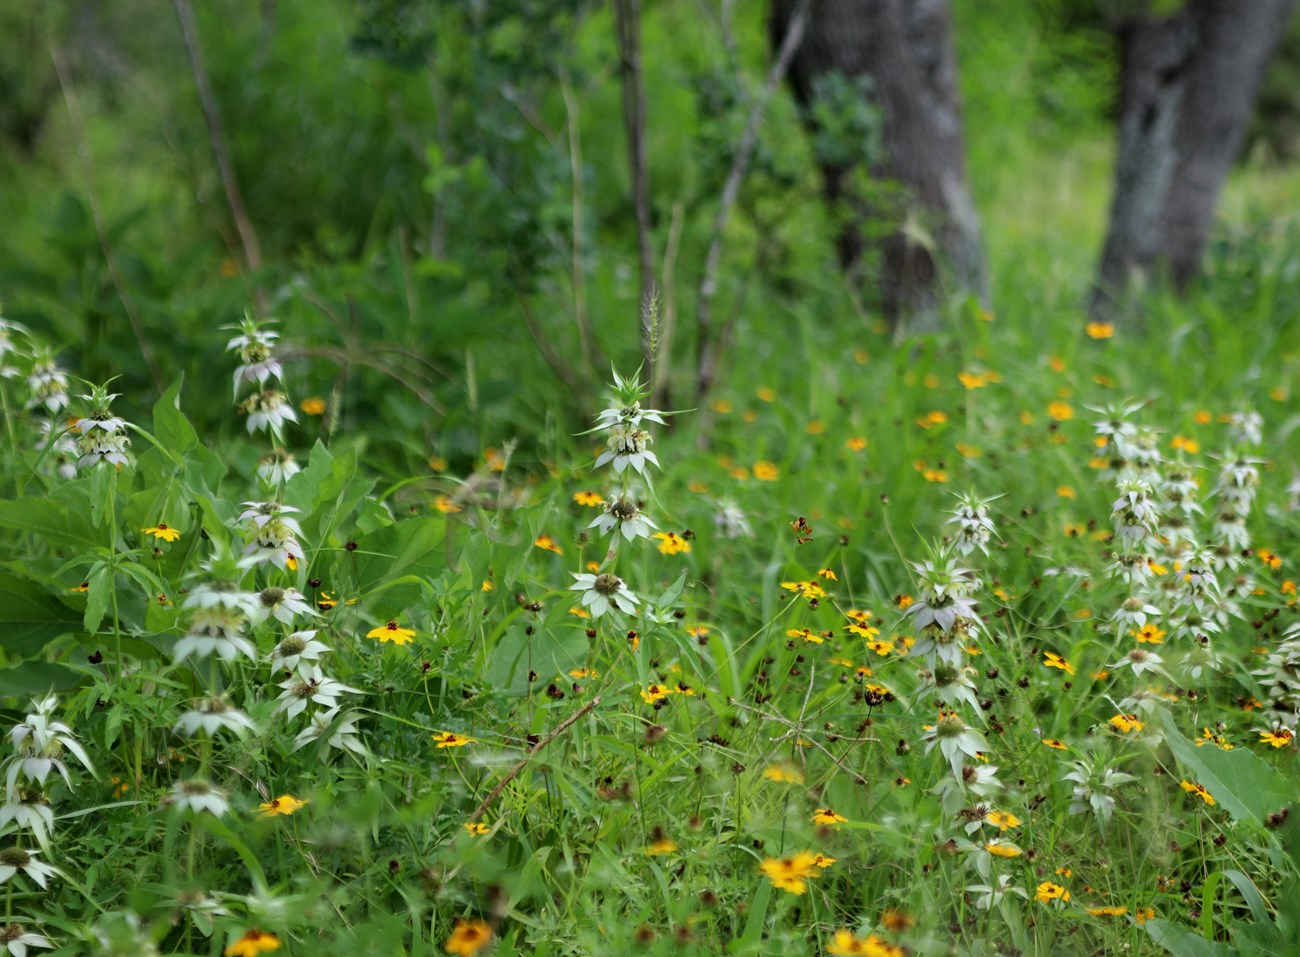
GULN/NPS
Summary and Key Findings
- In the summer of 2023, the GuIf Coast Inventory and Monitoring Network completed the second round of vegetation monitoring in long-term plots at San Antonio Missions NHP to track the health and condition of forests and other plant communities. The I&M plots were distributed in two areas of the park: the main Missions properties within San Antonio city limits and Rancho de las Cabras, about 23 miles south near Floresville, Texas.
- The park’s 10 I&M plots were representative of its main plant communities, which were primarily ruderal, post-agricultural forests and woodlands along the historic river corridor in the Missions unit, and upland shrublands that were previously used for grazing at Rancho de las Cabras. Past land uses were apparent in the vegetation composition of both units but more clearly so in the Missions, particularly in the mid/early successional forests and the dominance of invasive species in their understory, observed in both 2019 and 2023.
- The park’s upland shrublands had the highest richness among all of the park communities sampled. These areas were also notably rich in comparison to elsewhere in the Gulf Coast Network region, with one plot in Rancho de las Cabras holding the network-wide record. The pattern of higher richness in upland shrublands was unchanged between 2019 and 2023. Within units, richness values at Rancho were stable between 2019 and 2023, but in Missions, they were slightly higher in 2023, possibly due to a rainier May 2023 in that unit.
- Although plant communities were generally more intact at Rancho de las Cabras, one invasive grass was found to be widespread there in 2023. Guinea grass was not documented in the unit during its initial botanical inventory by William Carr in 2003, and the species was present but not dominant in several plots in 2019, with only 4% cover on average. In 2023, in contrast, it had 30% cover in plots, a change that was also associated with decreased cover of native wildflowers. The increased dominance of Guinea grass in recent years has been observed in other parts of southern and central Texas as well, placing this species as one of the top priorities for control on protected lands in the area.
Project Background
Throughout the National Park Service, plant communities and other key natural resources are monitored as indicators of environmental health by a nationwide program of 32 Inventory and Monitoring (I&M) Networks. The Gulf Coast I&M Network covers eight National Park Service (NPS) units in the southeastern U.S. and Texas. The network's terrestrial vegetation monitoring program is carried out in all eight parks, with the goal of measuring the health and condition of key plant communities repeatedly over time. Specific objectives include documenting status and change in (1) richness of native and non-native species; (2) percent cover and frequency of key species or growth forms (e.g., graminoids or shrubs); and (3) the health and regeneration of forests. The network's vegetation monitoring program follows a published protocol (Carlson et al. 2018) that is largely consistent with other I&M networks in the eastern U.S.
The Gulf Coast I&M Network conducts vegetation monitoring fieldwork once every four years in each park. This article presents a brief project overview and key findings from the 2023 I&M vegetation monitoring event in San Antonio Missions National Historical Park (NHP), Texas, which was the second round of sampling for the park (see Carlson [2020] for initial summary report). The Supplementary Materials package provides the full species list as well as several supporting tables and figures. All current and past reports, as well as raw data exports, can be found through the online project repository.
Study Area
San Antonio Missions NHP consists of four historic Spanish missions along the San Antonio River in central Texas. These four fortified settlements were established by Catholic missionaries in the early- to mid-1700s in an effort to gain Native Americans as citizens for New Spain. For 60- 100 years after each mission was established, inhabitants grew crops, raised livestock and also built a network of irrigation ditches, called acequias, to divert water from the San Antonio River into their crop fields. Most missions operated satellite ranches located further downriver, including what is now the park-owned Rancho de las Cabras, 23 miles southeast near the town of Floresville.Beginning in 1793, land ownership shifted towards private individuals as the Church-run settlements declined. Over time, the historic settlements developed into today’s city of San Antonio, which is currently the seventh largest city in the U.S. by population. The NPS began acquiring missions- related parcels in 1978, including those holding the stone churches, missions compounds, acequias, and some of the historic croplands. Today’s vegetation monitoring within the park focuses on the small areas of natural or regrown vegetation on park properties within city limits of southern San Antonio (referred to here as the Missions unit), as well as most of the Rancho de las Cabras property, which is rural and has minimal park infrastructure.
The landscapes of both the Missions unit and Rancho de la Cabras include low-lying areas adjacent to the San Antonio River and its tributaries, sloping transitional zones, and nearby uplands. Historic land use varied along these elevational gradients as well as between Missions and Rancho de las Cabras, and these differences are apparent in park plant communities today. The long-term plots in this study are organized into three broad vegetation classes: Riparian Forest, Ruderal Woodland or Forest, and Upland Shrubland. Figure 1 includes photos of representative plant species from the Riparian Forest (Figure 1A-D), the Ruderal classes, including several species that are widespread and found in most classes (Figure 1E-L), and Upland Shrubland (Figure 1M-P). All plant communities represented in this study, as well as others that were not sampled, have been described in the park’s vegetation community map (Cogan 2007) and botanical inventory (Carr 2003).
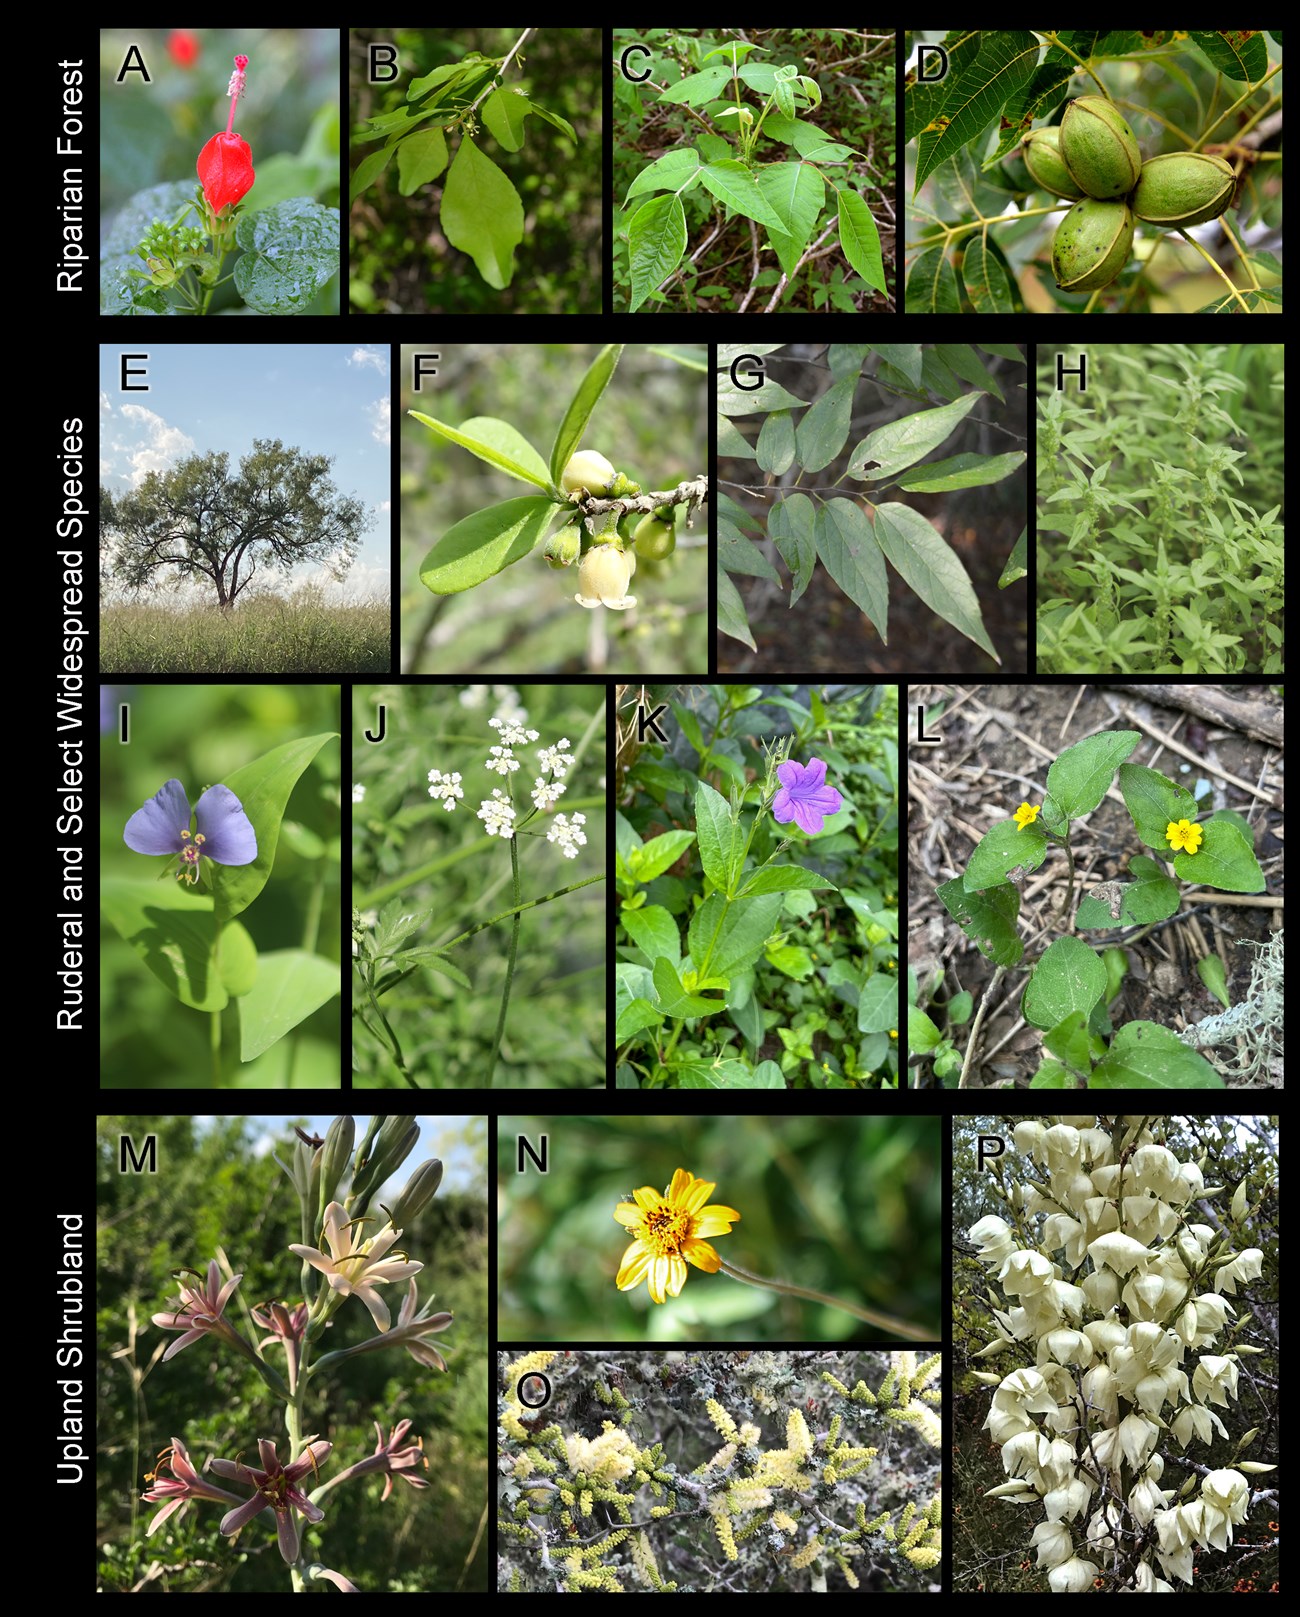
(K) violet wild petunia; (L) straggler daisy; (M) spotted false-aloe; (N) hairy wedelia; (O) blackbrush acacia; and (P) Buckley's yucca. See Supplementary Materials for Latin names.
Methods
San Antonio Missions NHP has ten long-term I&M plots distributed between the two focal park unit: Missions unit (5 plots) and Rancho de las Cabras (5 plots). Plot locations were assigned as a random draw of five points within all naturally vegetated areas within each unit. Plots were first visited during the spring and summer of 2019 to install plot markers, tag trees, and conduct the first round of sampling (details in Carlson 2020). Crews returned to sample plots for the second time in May 2023. Both sampling events used the methods published by Carlson and others in 2018, in the protocol “Monitoring Terrestrial Vegetation in Gulf Coast Network Parks” and its 11 standard operating procedure documents. In short, all plant species are identified in each 400 m2 (20 x 20 m) plot, and their coverages and relative frequencies are recorded in nested sampling frames. New tree recruits are tagged, i.e., those reaching ≥10 cm diameter at breast height (DBH) since the last sampling event, and then all newly and previously tagged trees are measured for DBH and assessed for damage. Juvenile trees are counted within four 10-m2 microplots per full plot, divided into classes of seedlings (heights up to 1.36 m) and saplings (heights taller than 1.36 m and DBH <10 cm). These data serve as a baseline for tracking forest health, including tree growth, recruitment, and mortality.
Key Findings
Vegetation Communities Sampled
In the Missions unit, three of five monitoring plots are within the historic riparian corridor of the San Antonio River (Figure 2). Because of channelization and flow controls that changed the river’s course, most notably in the 1950-1970s, these plots have long been cut off from intermittent, seasonal flooding. Only one plot in the I&M sample has retained a species composition characteristic of a Riparian Forest, Mi01. The other two lowland plots are in river-adjacent, historic crop fields that were first farmed under Missions ownership in the late 1700s and continued as such, on and off, through the 1980s, after which forests regrew. These areas are classified as Ruderal Woodland or Forest for their ruderal, mixed assemblage of riparian- associated trees, honey mesquite (Prosopis glandulosa), and weedy herbaceous species. A third Ruderal Woodland or Forest plot is on a small, human-impacted terrace located near Mission Espada. Only one Missions plot is truly upland in elevation and composition, in the Upland Shrubland class (Figure 2). At Rancho de las Cabras, in contrast, Upland Shrubland is the most well-represented class (Figure 2). Past land uses were less intensive at Rancho de las Cabras than at Missions, but several Rancho plots are nevertheless in areas that had previously been cleared and planted in non-native coastal bermuda grass (Cynodon dactylon) for cattle grazing (see Supplementary Materials for plot-level historical land uses and relevant citations). Most of these activities had ended by the 1980s, but the easternmost portion continued as an improved pasture through 2002, after which a fairly even-aged stand of honey mesquite became established. The single plot in this stand is classified as Ruderal Woodland or Forest.
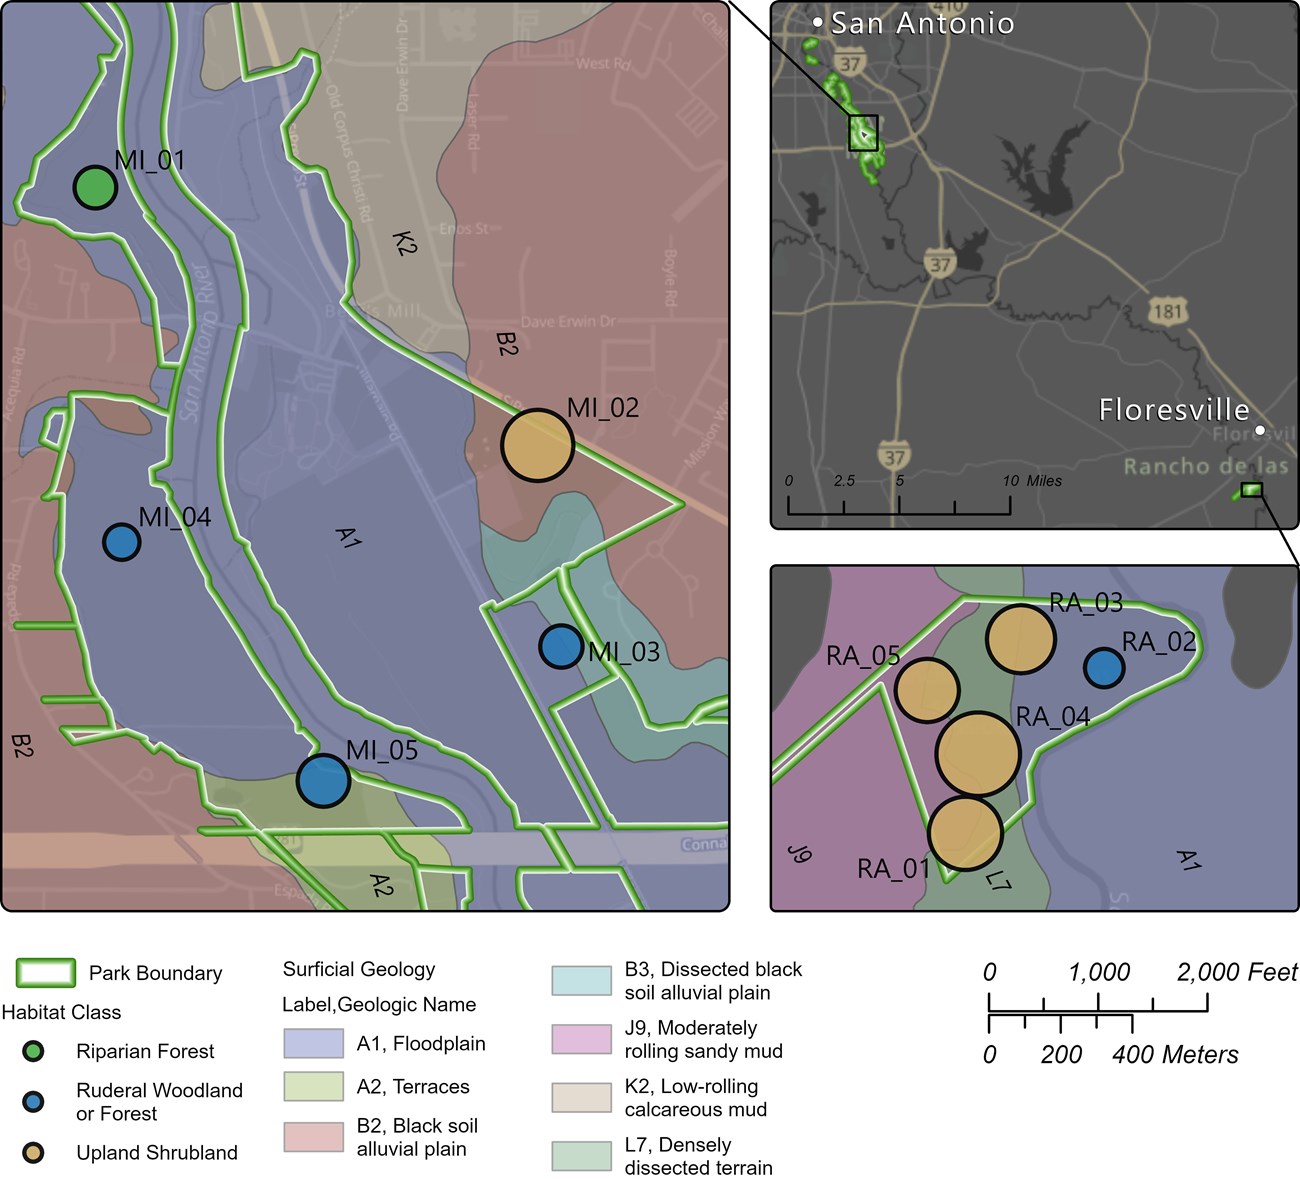
Plot IDs are labelled, and select surficial geology classes are included in each unit-level map as colored and labeled polygons. Soil types are mapped at finer scales and may differ from surficial geology (see details in Supplementary Materials).
The ten I&M plots captured the dominant natural vegetation classes in the park, but some of the less common and unsampled communities are nevertheless of high importance for natural resource management in the park. For example, the Riparian Forest at Rancho was not captured in the random draw of plots there, and its character is likely different than that of the Missions unit. Also of major interest among the park’s unsampled areas are patches of wildflowers (also called forbs) and native grasses, which historically would have been midgrass prairie on sandy loam soils and tallgrass prairie on dark clayey soils. Small clearings with prairie plants can still be found intermixed with shrubs in the Upland Shrubland classes in both units, and the park also has two prairie restoration sites, one near the San Juan dam and the other in Rancho de las Cabras. Although these sites lack I&M plots, the network has supported monitoring of the prairie restoration areas since 2019 (see Supplementary Materials for more details).
Park-Wide Richness Summaries and Notable Species
Across all ten plots sampled in 2023, I&M staff recorded 230 plant taxa. There were 149 taxa recorded at the Missions and 168 at Rancho de las Cabras, with a 38% overlap between the units. Ninety-seven percent of the total could be identified to genus or species level, leaving eight taxa as unknown, most often because all individuals were immature.
The four most widespread species in the I&M sample – each a native species and present in all ten plots– were sugarberry (Celtis laevigata; Figure 1G), cucumber weed (Parietaria pensylvanica; Figure 1H), slender yellow woodsorrel (Oxalis dillenii), and brasil (Condalia hookeri). The full species lists for 2023 vegetation monitoring is provided in the Supplementary Materials document, and it includes the plot-level relative frequency of each species within each unit.
Thirteen non-native species were identified in I&M plots within the park. Eleven of these were recorded at Missions, and seven were recorded at Rancho. This was a low percentage of non-native species within the full species list (6%), Missions alone (7%), or for Rancho alone (4%). Even so, all plots had at least one non-native species present, and several of these non-natives were widespread. The most widespread non-native in the Missions unit was hedge parsley (Torilis arvensis; Figure 1J), in all five plots. At Rancho, rescue grass (Bromus catharticus) and Guinea grass (Megathrysus maximus) were widespread, with both species in four of the five plots. Being present in most plots indicates that a non-native is widely-distributed within the park, but the greatest cause for concern is when non- natives come to dominate the communities where they occur and outcompete native species. Percent cover values for non-natives and other dominant species in the plots are presented further below, including how coverage values have changed between 2019 and 2023.
None of the species recorded in 2023 were threatened or endangered, based on state or federal lists, but plots contained four endemic species with small geographic ranges. Two of these species spanned both park units: widow’s tears (Tinantia anomala; Figure 1I), found in six of ten plots, and Brazos rockcress (Arabis petiolaris) in four of ten plots.
Both species are annuals and may be locally common in the habitats where they occur. Two other endemic species were seen in only one plot each and are classified as rare and potentially vulnerable, i.e., listed among Texas Species of Greatest Conservation Need (Texas Parks and Wildlife 2012, list updated in 2024). These species were Greenman's bluet (Houstonia parviflora) at Missions and arrowleaf milkvine (Matelea sagittifolia) at Rancho. The former was first documented at both units by Carr (2003) in the park’s botanical inventory, and the latter was first documented by I&M at Rancho in 2019. The new record for arrowleaf milkvine is one of the 24 species that I&M and collaborators have added to the unit-specific lists since monitoring began. See Supplementary Materials for full list of new species.
Given that 2023 was the second round of sampling for the park, some context may be gained from informal comparisons with the 2019 summaries. In 2019, the total number of species recorded during monitoring was 211 taxa, which was lower than the 230 taxa recorded in 2023. This increase over time was largely due to more species being recorded in Missions in 2023 (149 in 2023 versus 119 in 2019), with very little change at Rancho (168 in 2023 versus 172 in 2019). It is expected that species counts will vary among years due to plant population dynamics and shifting locations of both annual and perennial species. Weather can be a major contributor as well, and the two units experienced slightly different rainfall patterns, based on gridded monthly rainfall data for each unit. Over the 30 days before sampling each year, there was less rain in 2019 than in 2023, by 10 cm at Missions (82 versus 186 mm in May) but only by 4 cm at Rancho (121 versus 164 mm in May). Even going back until March of each year, Missions was the drier of the two units in 2019. A likely result of this difference was that Mission plants were experiencing more drought stress during the late-May sampling event in 2019 than they were in 2023. At Rancho, in contrast, conditions were relatively similar for both events.
The degree of drought stress may be apparent from plant condition on-site, but it can also be measured indirectly based on calculations of Water Deficit, one of several gridded water balance metrics available from NPS on NASA AppEEARS. These variables are useful for understanding how temporal changes in rainfall, temperature and drought are impacting plants throughout national parks in the U.S. (e.g., Tercek et al. 2021). A closer examination of the impacts of rainfall, water deficit, and other agents of change on species richness and abundance at San Antonio Missions NHP can be made after several additional rounds of data collection.
Plot-Level Richness Summaries by Unit and Vegetation Class
There were 70 plant species per plot, on average, across all vegetation monitoring plots at San Antonio Missions NHP. The two sampled units differed notably in richness per 400-m2 plot, with Rancho plots having 20 more species, on average, than Missions plots (Table 1; Figure 2). This was in part because four of the five Rancho plots were in the relatively rich Upland Shrubland class, with its diverse herbaceous groundcover in a matrix with shrubs, cacti,yuccas, and honey mesquite. Across both units, plots in this class had an average of 51 forb species, which are defined here as non-woody flowering plants excluding grasses, sedges, and vines. The next richest growth form in this class was graminoids (i.e., grasses and sedges), at 15 species per plot. See Supplementary Materials for more on species richness per plot, categorized by growth form.
The high richness of the park’s Upland Shrubland sites is particularly notable within the context of the eight parks monitoring by the Gulf Coast Network. Across the 194 plots that have been sampled at least once, the average plot contained 42 species in its most recent sampling event. San Antonio Missions NHP holds the network-wide record of 105 species in a single plot, Ra04, in 2019. The 2023 count for that plot was the second highest, at 103 species. The overall species count for the two prairie restoration sites is also impressive, at 157 species at Rancho and 133 species at Pyron Street prairie, each based on 90 1-m2 plots. These prairie restoration sites contain many additional forb species and several additional grass species not recorded in the regular I&M monitoring plots (see Supplementary Materials for lists).
Table 1. Mean plant species richness per plot in 2023, summarized for each unit and the three broad vegetation classes in the park. Species counts include all species recorded in each plot, whether they are rooted in, overhanging, or prostrated across the plot. Mean richness includes unidentified species with unknown nativity status, and non-native richness includes only fully identified species. * =only one plot in this class within the unit.
| Vegetation class | Missions mean plot richness, overall (range) | Missions mean plot richness, non-natives (range) | Rancho mean plot richness (range) | Rancho mean plot richness, non-natives (range) |
|---|---|---|---|---|
| Upland Shrubland | 88* | 5* | 89 (78-103) | 3 (1-5) |
| Ruderal | 52 (42-63) | 5 (5-6) | 46* | 4* |
| Riparian | 50* | 5* | - | - |
| Overall | 59 (42-88) | 3 (5-6) | 80 (46-103) | 3 (1-5) |
Ground and Mid-Story Percent Cover by Unit and Vegetation Class
To help characterize the structure and key species of the ground- and mid-story, percent cover was recorded for all foliage and stems up to five meters above ground level. Estimates were made for each species within four 10-m2 corner microplots for each 400-m2 plot. Figure 3 shows mean percent cover for the top 15 species in each broad vegetation class in each unit, illustrating which species and growth forms were dominant, and where. In the Missions unit, the Ruderal class had high coverage (>20%) of two tree species, honey mesquite and sugarberry, as well as moderate coverage (5-19%) of several weedy forbs. The Riparian class had moderate to high coverage of forbs and vines, most of which were weedy, and high coverage of possum-haw (Ilex decidua). The Mission's Upland Shrubland class had high shrub coverage of agarita (Mahonia trifoliolata) and brasil, as well as moderate coverage of three more woody species. Rancho's Upland Shrubland class also had five woody species with moderate to high coverage, but the dominant species differed. Most notably, the Upland Shrubland class at Rancho had high coverage of both honey mesquite and the non-native Guinea grass, which was a feature it shared with the single Ruderal plot at Rancho (Figure 3).
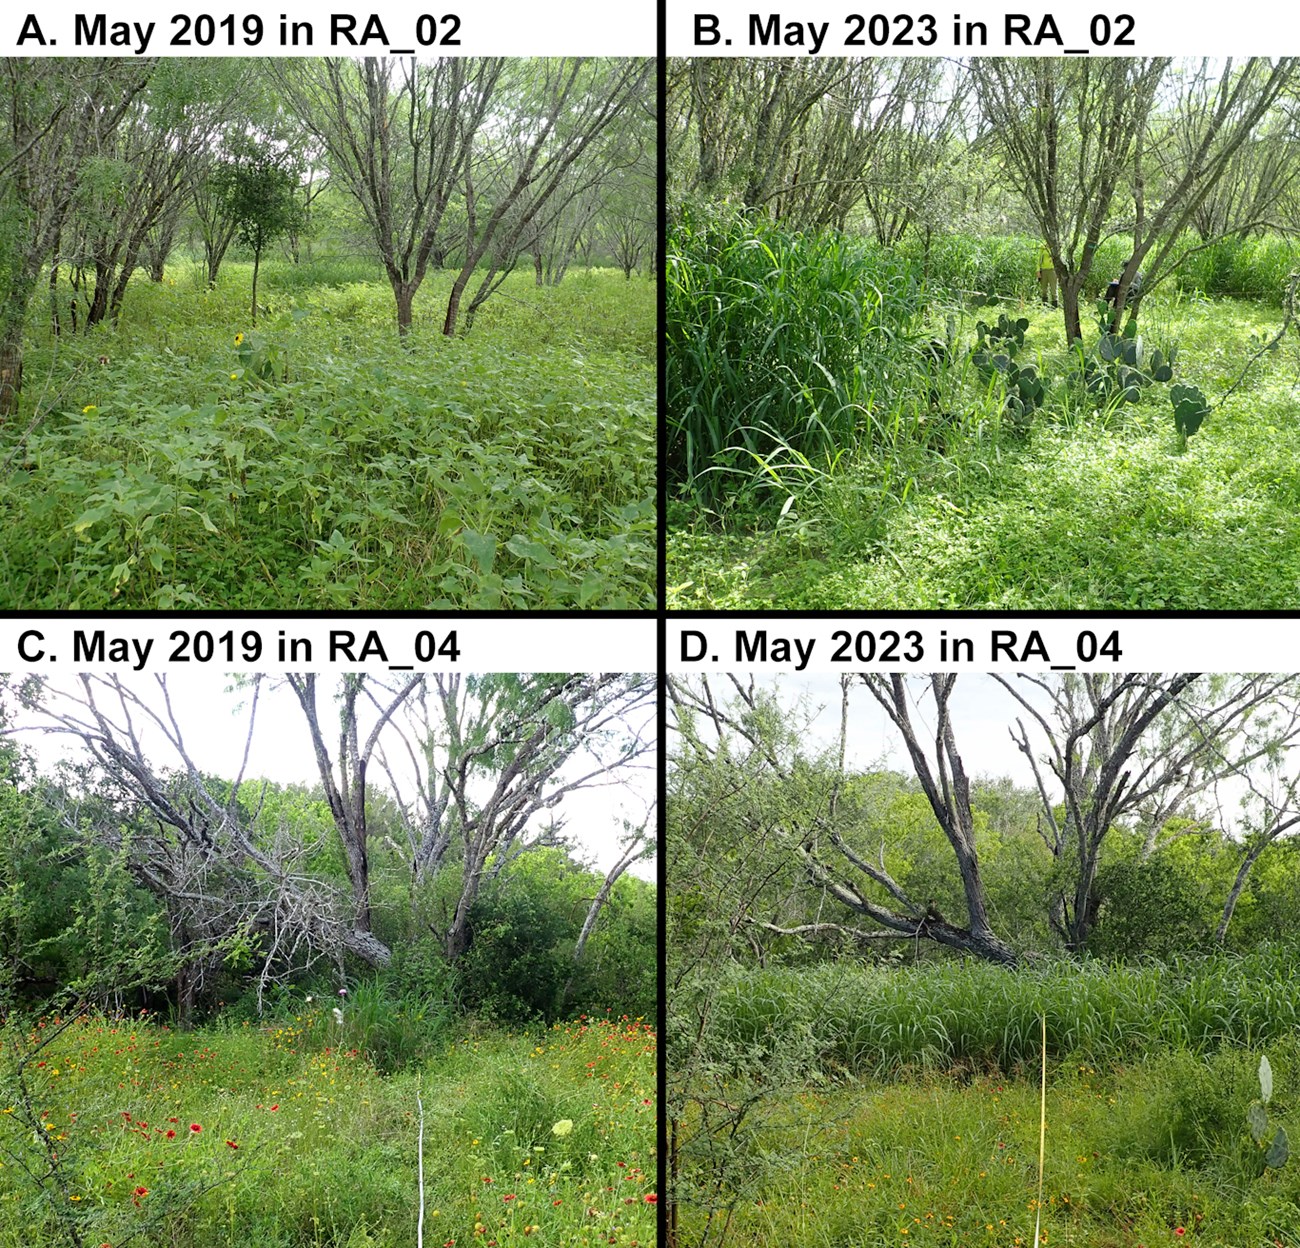
The dominance of honey mesquite and Guinea grass in both classes at Rancho revealed an unexpected level of disturbance that required further examination. Abundant honey mesquite generally indicates a history of clearing or farming, which are known historic uses of most plots at Rancho, from 20+ years ago. Guinea grass, in contrast, is a newly prominent plot feature since 2019, as is clear from site photos (e.g., Figure 4). Coverage estimates for 2023 were 28% in Upland Shrubland (range 0-63%) and 38% in Ruderal Woodland or Forest. The following comparison of 2019 and 2023 datasets provides a preliminary measure of Guinea grass expansion and its impacts for surrounding plants.
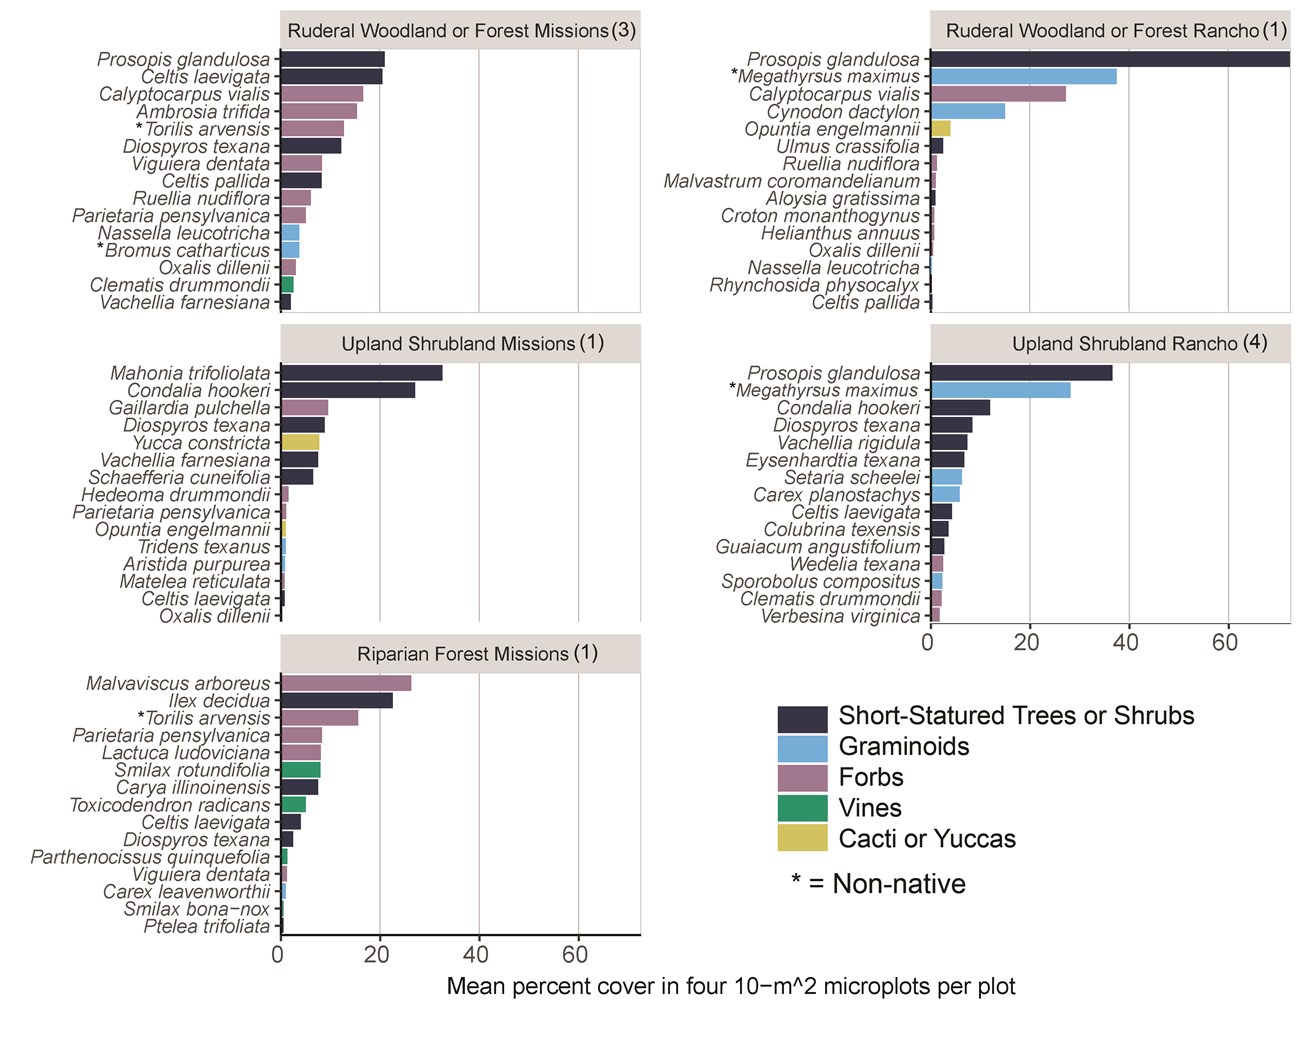
Those species are not shown on the figure and include: Eysenhardtia texana (a shrub) in Upland Shrubland at Rancho; Verbena halei (a forb) in Ruderal Woodland or Forest at Rancho; and Rubus sp. (a vine) in Riparian Forest at Missions.
There were also similarities in cover types within units. For example, Missions vegetation classes tended not to be dominated by a single species, in that none had greater than a third mean coverage of microplot ground area (Figure 3). Rancho vegetation classes, in contrast, were strongly dominated by honey mesquite, with that species covering 37% of microplot area, on average, for the Upland Shrubland class and 73% for the Ruderal class. Both Rancho vegetation classes also had high coverage of Guinea grass, at 28% and 38% respectively. Guinea grass is a newly prominent feature of most Rancho plots since 2019, as is clear from site photo comparisons (Figure 4). To determine the extent of this invasion, additional comparisons are made for 2019 and 2023 data for this species in the next section.
Invasion of Guinea Grass Over Time
To quantify the change in Rancho plant communities being invaded by Guinea grass, percent cover estimates from 2023 were compared to those from 2019. The expectation was that Guinea grass was most likely to displace other herbaceous species, so separate comparisons were made for Guinea grass, other graminoids, and forbs. These comparisons showed that on average, Guinea grass increased in cover over the 4-year period from 4% to 30%, which was an increase of 26% (Figure 5). There was notable variation between Rancho plots, however, with one plot increasing in Guinea grass by 53% (from 10% in 2019 to 63% in 2023), three plots increasing by around 20%, and one plot, Ra05, having virtually no Guinea grass in either year. Of the two other herbaceous growth forms, only forbs showed decreased cover between years, with a 38% decline, on average. Other graminoids, in contrast, remained relatively low and stable in their cover estimates (Figure 5). The changes for forbs and Guinea grass are nevertheless both consequential, and they seem unrelated to different growing conditions between 2019 and 2023, since, as mentioned earlier, rainfall in the spring and early summer at Rancho was very similar for the two monitoring years. All in all, these preliminary comparisons suggest that native species are being displaced, and Guinea grass invasion is a significant problem at Rancho.

Tree and Regeneration Metrics
Forest health metrics were recorded in all plots that contained at least one tree, i.e., at least one woody stem with DBH ≥ 10 cm. All plots except Ra05, an Upland Shrubland plot, met this threshold. Of the nine plots with trees, the average number of stems per plot was 14, with a range of 2-27 (see Supplementary Materials for plot-level summaries). Across both units, 63% of stems belonged tohoney mesquite, followed by sugarberry at 34% of stems. Multiple stems from the same base were tagged and measured separately, as long as they met the DBH threshold individually. Of the 109 live trees that were measured in 2023, 25 had multi-stemmed trunks, and most of these were honey mesquite. The average DBH per plot was only 16 cm, and the range in plot averages was 13-22 cm. These small values indicate the park’s forests, woodlands, and shrublands are currently dominated by young or small-statured trees, although the park is known to contain a few notably large trees outside of monitored plots.
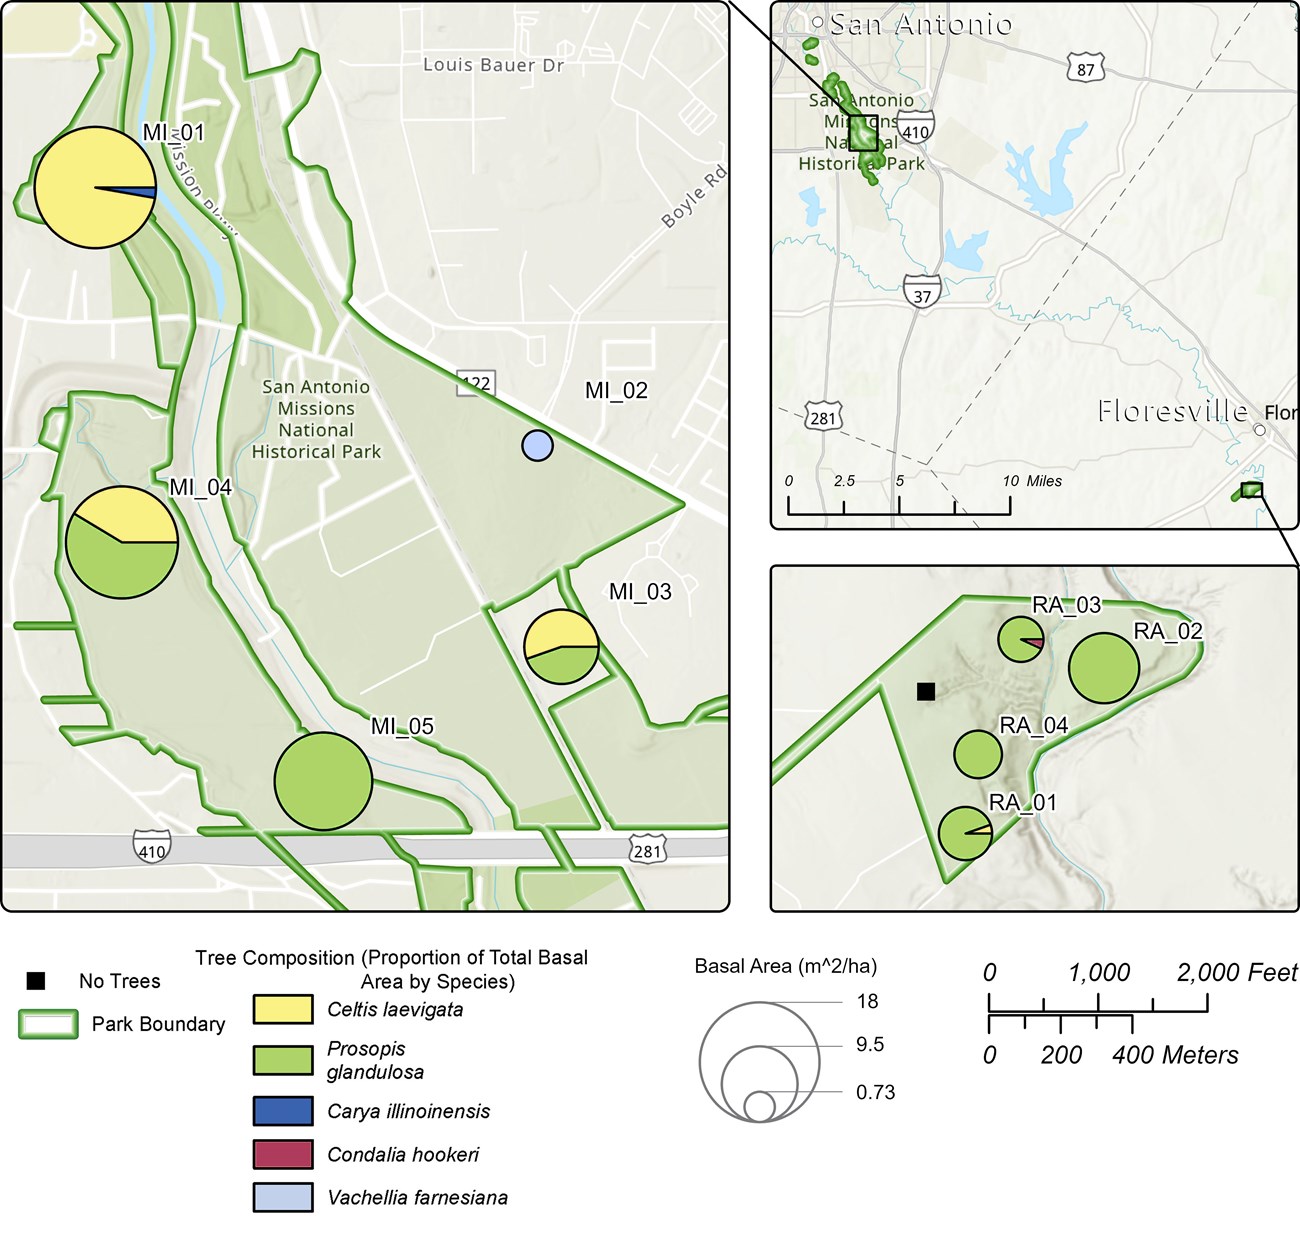
Tree basal area, an index that combines both DBH and stem density, varied widely among plots, with only a few patterns apparent within and between units (Figure 6). There were more trees in Missions plots than in Rancho plots, resulting in higher basal areas for plots in the Missions unit. Additionally, two tree species had relatively high basal area in Missions plots but were nearly absent from Rancho plots. These were sugarberry, which dominated the single Riparian plot and was fairly common in two of the Ruderal plots, and huisache (Vachellia farnesiana), which dominated the single Upland Shrubland plot (Figure 6).
A subset of forest health measurements from 2023 were compared to those from 2019, revealing major gains or losses in stem counts for four of the 10 plots, and relatively low growth rates in terms of DBH (see Supplementary Materials for plot-level summaries and means). The single plot that gained several stems was Ra02, which had been taken out of cultivation around 2002, much later than all other post-agricultural plots in the park. The honey mesquite regrowth that occurred there between 2019 and 2023 was enough to cause many of the existing stems to enter into the adult tree size class. The change in plot condition for Ra02 is visible in the multi-temporal aerial images in the Supplementary Materials document.
The three plots with significant tree mortality were all in the Missions unit. First, the Riparian Forest plot Mi01 had one of the park’s largest tagged trees in 2019, but this sugarberry was dead by 2023, creating a major canopy gap that fostered growth of vines and forbs in the understory. Second, the Upland Shrubland plot Mi02 had four live huisache trees in 2019 that were nearly completely dead by 2023. Of the 14 original live stems, only 2 persisted into 2023, each a separate tree. Third, the Ruderal plot Mi04 lost seven of the 29 stems tagged in 2019, although most were part of multi-stemmed honey mesquite trees that had at least one surviving stem by 2023.
Across all three of these plots, some of the stems that died were already in poor condition in 2019, but this was not always the case. Between 2019 and 2023, there were several extreme weather events that had potential to exacerbate the park’s natural rates of tree mortality and successional change. These events included an unusually prolonged hard freeze and snowstorm in mid-February 2021, intense heatwaves in summer 2022, and a severe drought from early 2022 through March 2023. Although this series of events likely had negative consequences for certain plants on the park, it is difficult to unravel their relative importance without the benefit of more years of monitoring and weather data.
Conclusions
The plant communities at San Antonio Missions NHP are a product of the area’s altered, human-modified landscape. Even so, the two park units and the vegetation classes within them have not all been equally impacted, and patches of the area’s rich native communities were occasionally represented in the sample. The historic floodplain of the San Antonio River, where three monitoring plots occur, has had the greatest departure from pre-settlement landscape. Its regrowth into ruderal, post-agricultural forests and woodlands also differs from what was likely present during the time of the Spanish missions, yet it still sustains native plant populations, even if predominately weedy, and provides habitat for wildlife.
The five higher-richness shrubland plots and nearby prairie restoration sites have also been shaped by human activities, though often to a lesser extent. Some farming occurred in these upland areas, but most plots were mainly subjected to livestock grazing and other ranching practices. Because of these lesser impacts, extant Upland Shrublands and prairie restoration sites provide a window into what was the dominant historic landscape of the area. Prior to European settlement, there was tallgrass prairie outside of the San Antonio River floodplain in the Missions area and calcareous Tamaulipan thornscrub and mid-grass prairie savanna at Rancho. Due to fire suppression and increased grazing pressure beginning over a century ago, shrubs and mesquite have become much more prevalent in these upland plains and rolling hills, and contain far less grass cover and grass diversity, relative to the community’s reference state (USDA NRCS 2023). Even so, some of the species that characterize these grasslands have been recorded in the Upland Shrublands and prairie restoration sites in one or both units (see Supplementary Materials for details). For this reason, forb- and shrub-rich Upland Shrublands and prairie restorations reflect a special resource for the park and its wildlife, particularly as a food resource for herbivores and pollinators. These areas may also serve as a reserve of native grassland and savanna species that have been eliminated from nearby sites by intensive grazing or human development.
Although plant communities were generally more intact at Rancho de las Cabras than at Missions, one invasive grass was found to be newly widespread there in 2023. Guinea grass was not recorded at Rancho during the park’s botanical inventory in 2003, and although present in 2019, its coverage was fairly low in the I&M sample, at only 4% on average. By 2023, however, average cover had increased to 30%. This change was linked to a decline in forb cover by 2023, suggesting that this relatively new invader is a threat to the unit’s rich herbaceous flora. Guinea grass is also present in the city of San Antonio, even if not currently documented in any of the I&M plots. On the Missions properties within city limits, there remain relatively few areas with intact upland shrubland plant communities, but those that exist may be at risk. Guinea grass is also a known problem in several habitat restoration projects along the San Antonio River, including areas close to the NPS Missions properties.
Although plant communities were generally more intact at Rancho de las Cabras than at Missions, one invasive grass was found to be newly widespread there in 2023. Guinea grass was not recorded at Rancho during the park’s botanical inventory in 2003, and although present in 2019, its coverage was fairly low in the I&M sample, at only 4% on average. By 2023, however, average cover had increased to 30%. This change was linked to a decline in forb cover, suggesting that this relatively new invader is a threat to the unit’s rich herbaceous flora. Guinea grass is also present in the city of San Antonio, even if not currently documented in any of the I&M plots. On the Missions properties within city limits, there remain relatively few areas with intact shrubland plant communities, but those that exist may be at risk. Guinea grass is also a known problem in several habitat restoration projects along the San Antonio River, including areas close to the NPS Missions properties.
The rapid spread of Guinea grass in southern Texas has been a cause for alarm among land managers throughout the region, including in San Antonio itself. Recent studies and reviews have explored the mechanisms of spread and best management practices in semi-arid habitats (e.g., Rhodes et al. 2021; Rhodes et al. 2022; Wied et al. 2020). At San Antonio Missions NHP, resource management staff and NPS Invasive Plant Management Teams have begun treating it as a high priority for control within the park.
Acknowledgements
Participants in the 2023 vegetation monitoring field effort at San Antonio Missions included the author, I&M program geographer Jeff Bracewell and intern Kimberly Bowman, Joel Osborne (San Antonio Missions Biologist), Allison Young (San Antonio Missions Integrated Resources Program Manager), and Sonya Marin (San Antonio Missions Intern). Data entry and table assembly was completed by Jane Carlson, Fabi Speyrer (network staff member), and I&M program interns Kimberly Bowman and Olivia Butler. Jeff Bracewell created the maps. Editorial support came from Jeff Bracewell and Martha Segura, network program manager.
Article written by Jane Carlson, NPS Gulf Coast Inventory and Monitoring Network
-
Carlson, J.E., J. Bracewell, W. Granger, and M. Segura. 2018. Monitoring vegetation in Gulf Coast Network parks: Protocol implementation plan. Natural Resource Report NPS/GULN/NRR—2018/1746. National Park Service, Fort Collins, Colorado.
-
Carlson, J.E. 2020. Trip Report for Vegetation Monitoring at San Antonio Missions NHP 2019. Gulf Coast I&M Network, Lafayette, LA. https://irma.nps.gov/DataStore/DownloadFile/640441
-
Carr, W.R., 2003. A botanical inventory of San Antonio Missions National Historical Park, Parts I and II. Reports for the Gulf Coast Network, National Park Service, Lafayette, LA.
-
Cogan, D. 2007. San Antonio Missions National Historical Park vegetation classification and mapping project natural resource report. A report for the Gulf Coast Network. National Park Service, Lafayette, LA.
-
Rhodes, A.C., R.M. Plowes, J.R. Lawson, and L.E. Gilbert. 2022. Guinea grass establishment in South Texas is driven by disturbance history and savanna structure. Rangeland Ecology and Management 83: 124-132. https://doi.org/10.1016/j.rama.2022.04.003
-
Rhodes, A.C., R.M. Plowes, J.A. Goolsby, J.F. Gaskin, B. Musyoka, P. Calatayud, M. Cristofaro, E.D. Grahmann, D.J. Martins, L.E. Gilbert. 2021. The dilemma of Guinea grass (Megathyrsus maximus): a valued pasture grass and a highly invasive species. Biological Invasions 23: 3653-3669. https://doi.org/10.1007/s10530-021-02607-3
-
Tercek, M.T., D. Thoma, J.E. Gross, K. Sherrill, S. Kagone, G. Senay. 2021. Historical changes in plant water use and need in the continental United States. PLOS ONE 6(9): e0256586 https://doi.org/10.1371/journal.pone.0256586
-
USDA NRCS. 2023. Ecological site R083AY019TX: Gray Sandy Loam. https://edit.jornada.nmsu.edu/catalogs/esd/083A/R083AY019TX. Accessed February 2024.
-
Wied, J.P., H.L. Perotto-Baldivieso, A.A.T Conkey, L.A. Brennan, J.M. Mata. 2020. Invasive grasses in South Texas rangelands: historical perspectives and future directions. Invasive Plant Science and Management. 13(2):41-58. doi:10.1017/inp.2020.11
Supplementary Materials
Supplementary materials to this report are available in the NPS datastore, as are all previous project briefs. Follow the link below for the 2023 Supplementary Materials, which links to all other project materials.


