Several types of data are needed to accurately quantify the acoustic environment of a park.

NPS Photo
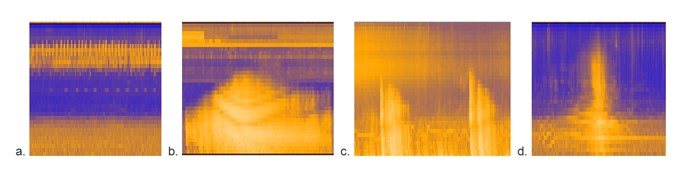
Describing the acoustic environment.
At each site, monitoring equipment takes sound pressure level and frequency readings. The sound pressure level (loudness) is recorded in decibels (dB) and the frequency (pitch) of a sound is recorded in hertz (Hz). Currently, sound equipment used in the parks can record sounds from 12.5 to 20,000 Hz, which exceeds the human hearing range. High frequency sounds (a cricket chirping) and low frequency sounds (water flowing in a river) often occur simultaneously, so we split the frequency spectrum into 33 smaller ranges, each encompassing one-third of an octave.
For each one-third octave band, dB level is recorded once per second for the duration of the monitoring period. Recording the sound intensity of each one-third octave band (combined with digital audio recordings described below) allows acoustic technicians to determine what types of sounds are contributing to the overall sound pressure level of a site. At sites where the sound pressure levels are very low, it is ideal to monitor with low-noise, high-sensitivity microphones. For some types of analysis, dB levels are A-weighted (dBA) to more closely represent the sensitivity of the human ear to different frequency ranges. (See Understanding Sound for more information on A-weighting).
Sounds are represented visually using a spectrogram, an image that incorporates frequency (y axis), time (x axis), and amplitude (brightness of color).
NPS Photo series
Digital Audio Recordings
An archive of sounds
In order to accurately understand a park's acoustic conditions, it is important to know the types of sounds present, their sources, and levels. Digital recordings (.mp3 or .wav files) provide one way of analyzing these factors. Recordings help park staff identify sources, determine noise levels, and devise how to manage them. Park rangers also use sound recordings for educational programs (see Teaching Materials for example programs). The ability to analyze acoustical data is continually improving. High-quality archival recordings make it possible to compute any conceivable metric for future analysis. Metrics specified today will likely change and be inadequate to meet all future needs. Digital recordings provide an archival record of the soundscape of the area.

NPS Photo by Emma Brown
Do you hear what I hear?
Acoustic technicians conduct several hours of on-site listening at each monitoring location. This involves sitting quietly and noting each sound heard in a handheld digital device. From these data, we can learn how often and long each sound is audible, and how much noise-free time occurs. On-site listening data create a sound inventory for each site that supports later data analysis.

NPS Photo by Cecilia White
Weather matters!
Sound waves traveling through the air are influenced by air temperature and humidity. Wind can sometimes mask other sounds, making them difficult to hear. Consequently, each acoustical monitoring system is paired with a miniature weather station that logs temperature, humidity, wind speed and direction for the entire monitoring period. Hours with wind speeds in excess of 5 meters per second are excluded from certain types of analysis due to interference.
Last updated: February 18, 2018